A real-time business intelligence dashboard with customizable widgets and AI-driven insights.
An enterprise-grade analytics platform that aggregates data from multiple sources into a unified dashboard. Built with React and D3.js for interactive visualizations, it features drag-and-drop widget customization, scheduled PDF reports, and AI-powered anomaly detection. The backend pipeline runs on AWS Lambda with Python for data transformation.
Drag-and-drop widgets to build personalized views for every team.
Live-updating charts and KPIs with sub-second refresh rates.
Automated anomaly detection and trend analysis with natural language summaries.
Auto-generate and email PDF reports on daily, weekly, or monthly schedules.
Connect databases, APIs, spreadsheets, and third-party tools as data sources.
Share dashboards with role-based access and embedded view links.
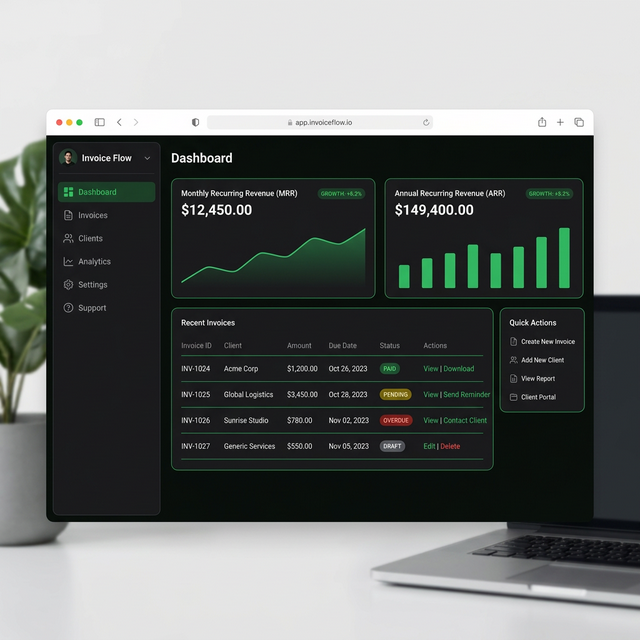
Professional invoicing and automated payment management for modern freelancers and businesses.
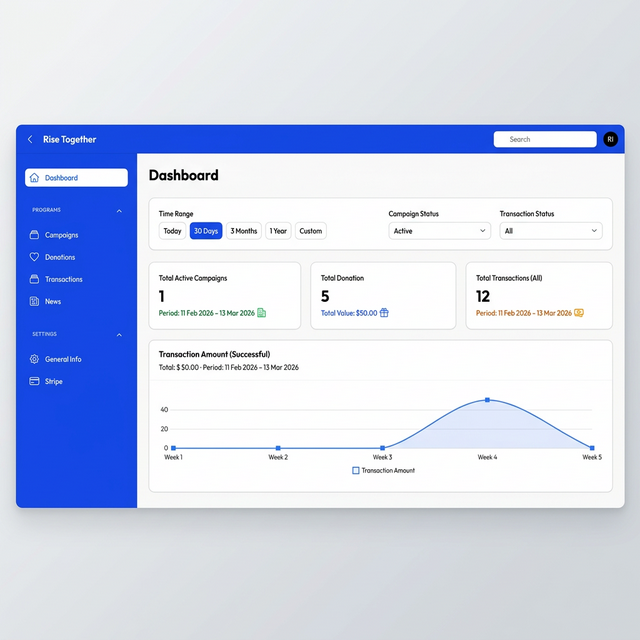
A modern crowdfunding platform enabling community support through seamless digital donations.
A full-featured online store with real-time inventory, payment processing, and an admin dashboard for managing products and orders.